

Seeing Beyond the Numbers:
Introduction to AI -
Powered Data
Visualisations
Read Time : 4 min
Download PDFData visualization has long been a cornerstone of data analysis, enabling businesses to translate complex datasets into actionable insights. However, with the advent of AI, the field has undergone a paradigm shift. AI-powered data visualizations go beyond traditional charts and graphs, leveraging Machine Learning (ML), Natural Language Processing (NLP), and advanced analytics to uncover hidden patterns, predict trends, and provide intuitive, interactive experiences.
According to Gartner, by 2025, over 50% of data stories will be automatically generated using AI, reducing the need for manual intervention and enabling faster decision-making. This evolution is driven by the increasing volume of data and the need for real-time insights in a competitive business landscape.
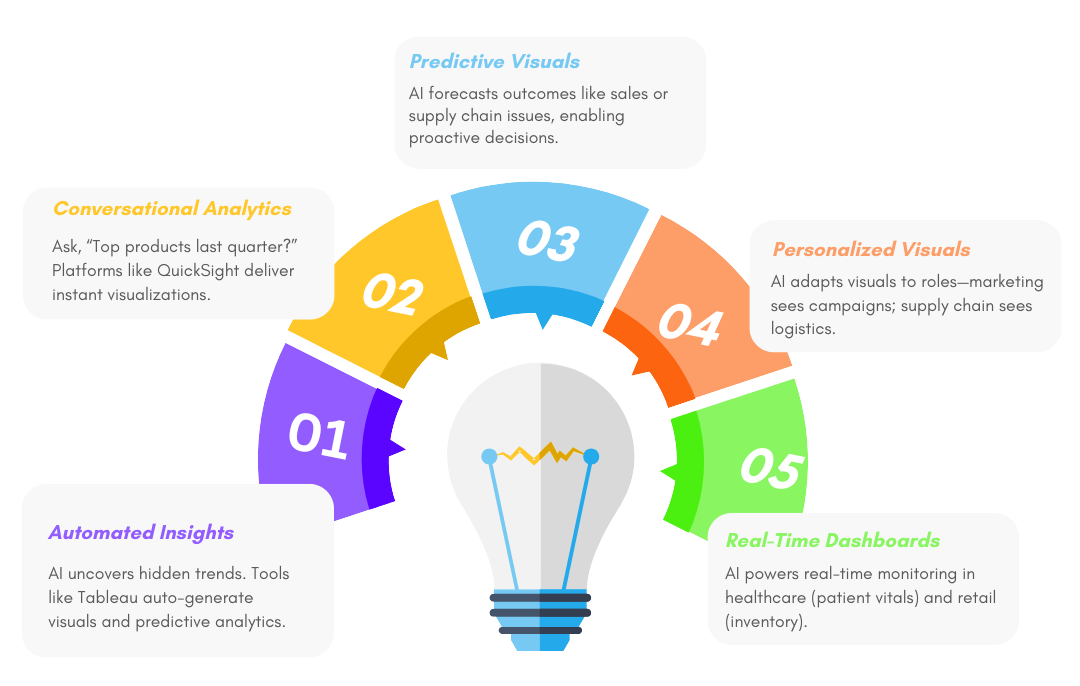
How AI Enhances Data Visualizations :
Applications of AI-Powered Data Visualizations
.png)
Business Intelligence (BI)
AI-enhanced BI tools are revolutionizing how companies analyze performance metrics, customer behaviour, and market trends. Forbes reports that companies using AI-driven BI tools have seen a 20-30% improvement in decision-making speed and accuracy
Healthcare
AI-powered visualizations are being used to interpret medical imaging, track patient outcomes, and predict disease outbreaks. For example, AI can visualize patterns in electronic health records (EHRs) to identify at-risk patients.
.png)
.png)
Finance
Financial institutions use AI to visualize market trends, detect fraudulent transactions, and optimize investment portfolios. Tools like Bloomberg and Morningstar are integrating AI to provide more intuitive and predictive visualizations.
Retail and E-Commerce
AI helps retailers visualize customer journeys, predict demand, and optimize pricing strategies. Amazon’s AI-powered recommendation engine is a prime example of how data visualizations can drive personalized shopping experiences.
.png)
.png)
Supply Chain and Logistics
AI visualizations enable companies to monitor supply chain performance, predict delays, and optimize routes. For instance, DHL uses AI to visualize global shipping networks and identify bottlenecks. Note:AI is reshaping supply chains by cutting inventory 20-30%, reducing logistics costs 5-20% (McKinsey), boosting revenue 10-20%, and minimizing errors up to 50% (BCG). With smarter forecasting and automation, businesses can enhance efficiency, lower costs, and drive growth
Benefits of AI-Powered Data Visualizations
Enhanced Decision-Making: AI provides deeper insights and actionable recommendations, enabling faster and more informed decisions.
- Improved Accessibility: NLP and automated insights make data visualization accessible to non-technical users.
- Scalability: AI can handle massive datasets, making it ideal for big data environments.
- Proactive Insights: Predictive and prescriptive visualizations help businesses anticipate challenges and opportunities.

Challenges and Considerations
While AI-powered data visualizations offer immense potential, there are challenges to consider:
- Data Quality: AI is only as good as the data it processes. Poor data quality can lead to inaccurate visualizations.
- Ethical Concerns: Bias in AI algorithms can result in misleading visualizations, emphasizing the need for ethical AI practices.
- Skill Gaps: Organizations need skilled professionals to implement and interpret AI-driven tools effectively.

Future Trends in AI-Powered Data Visualizations
- Augmented Analytics: Gartner predicts that augmented analytics, which combines AI and ML with BI tools, will become the dominant form of data analysis by 2025.
- Immersive Visualizations: The integration of AI with augmented reality (AR) and virtual reality (VR) will enable immersive data experiences.
- Explainable AI (XAI): As AI becomes more complex, there will be a growing demand for visualizations that explain how AI models arrive at their conclusions.
- Edge AI: Visualizations powered by edge computing will enable real-time insights in remote and resource-constrained environments.
Conclusion :
AI-powered data visualizations are transforming how businesses interpret and act on data. By leveraging AI, organizations can move beyond static charts and graphs to uncover deeper insights, predict future trends, and make data-driven decisions with confidence. As tools like Tableau, Amazon QuickSight, and others continue to evolve, the future of data visualization promises to be more intuitive, interactive, and impactful.
For your blog, consider including case studies, expert quotes, and examples from industries like healthcare, finance, and retail to make the content more engaging and relatable. Additionally, referencing reports from McKinsey, Gartner, and Forbes will add credibility and depth to your discussion.
Request for Services
Find out more about how we can help your organization navigate its next. Let us know your areas of interest so that we can serve you better